Todas las entradas hechas por David_H_Deans

How IT integrated systems revenue will reach $12.3 billion

More CIOs and CTOs are seeking to gain benefits of a simplified and more manageable IT infrastructure for their organisations. As a result, worldwide integrated systems revenue is forecast to total $12.3 billion in 2018 – that's an increase of 18.4 percent from 2017, according to the latest study by Gartner.

The hyperconverged integrated systems (HCIS) segment will experience the strongest growth (55 percent). By contrast, integrated stack systems will experience a five percent decline.

IT integrated systems market development

"The majority of integrated systems replace existing infrastructure, which is great for cost, agility and consolidation of IT and efficiency metrics," said Naveen Mishra, research director at Gartner.

When implementing this as part of a digital business initiative, however, IT organiSations must look at how the potential savings of capital expenditure (capex), may be offset by potential shifts in operating expenditure (opex). According to the Gartner assessment, the following trends are impacting the integrated services market.

Integrated infrastructure systems (IIS) integrate server, storage and network hardware, along with management software, to provide shared compute infrastructure. Gartner predicts that by 2019, 30 percent of organiSations that are due to refresh IIS will shift to newer, more flexible and cost-effective alternatives, such as reference architecture and HCIS.

HCIS is a platform offering shared compute and storage resources, based on software-defined storage, software-defined compute, commodity hardware and a unified management interface. Strong growth is being driven by organisations shifting away from IIS to HCIS for its support of wider data center uses.

Edge infrastructure is also expected to incrementally accelerate HCIS adoption. In particular, nonvolatile memory express (NVMe) protocol for flash technology is being embraced in HCIS to deliver better input/output operations per second (IOPS), smaller footprints, lower latency and power consumption.

Gartner predicts NVMe will account for 5 percent of HCIS spend by 2020, from virtually zero in 2017.

Reference architecture is the second-largest revenue contributor in the integrated systems market for 2018. It provides a documented representation such as a blueprint, document model or graphic that illustrates "how things fit together" to address a specific business need or opportunity.

Its value is to provide a common vocabulary, understanding and perspective to discuss implementation options, integration requirements and areas of customisation.

Outlook for integrated stack systems

Integrated stack systems comprised of server, storage and network hardware are integrated with application software to provide appliance functionality. These systems will slowly reduce their contribution to the overall integrated system market, primarily owing to the cloud-centric strategy driven by major IT providers.

That being said, Gartner forecasts that 20 percent of organisations with refresh due for integrated stack systems will likely shift to cloud-based alternatives by 2020.

How cloud service providers continue to drive server investment: A recap for Q417

Cloud service providers continue to drive computing server investment. Meanwhile, vendor revenue in the worldwide server market increased 26.4 percent year-over-year to $20.7 billion in the fourth quarter of 2017 (Q417), according to the latest market study by International Data Corporation (IDC).

The server market continues to gain momentum, as traction for newer Purley- and EPYC-based offerings grows. While demand from cloud service providers has propped up overall market performance, other areas of the server market continue to show growth now as well.

Global server market development

According to the IDC assessment, worldwide server shipments increased 10.8 percent year-over-year to 2.84 million units in Q417.

Volume server revenue increased by 21.9 percent to $15.8 billion, while midrange server revenue grew 48.5 percent to $1.9 billion.

High-end systems grew 41.1 percent to $2.9 billion, driven by IBM's z14 launch in the last quarter of 2017. However, IDC expects continued long-term secular declines in high-end system revenue, with short periods of growth related to major platform refreshes.

"Hyperscalers remained a central driver of volume demand in the fourth quarter with leaders such as Amazon, Facebook, and Google continuing their data center expansions and updates," said Sanjay Medvitz, senior research analyst at IDC.

ODMs continue to be the primary beneficiaries from hyperscale server demand. Some OEMs are also finding growth in this area, but the competitive dynamic of this market has also driven many OEMs such as HPE to focus on the enterprise.

Two key points to consider regarding new growth: IBM captured the third market position at 13 percent share with revenue growing 50.3 percent year-over-year to $2.7 billion. The ODM Direct group of vendors grew revenue by 48.1 percent to $4.2 billion.

Outlook for geographic growth trends

On a geographic basis, Canada was the fastest growing region in Q417 with 69.7 percent year-over-year growth. The United States grew 29.6 percent, Europe, the Middle East and Africa (EMEA) grew 17.4 percent, and Latin America declined 5 percent.

Asia-Pacific (excluding Japan and China) grew 38.2 percent, China grew 33.8 percent, and Japan grew 4.3 percent. The outlook for market growth in 2018 is equally encouraging.

That being said, there's another key trend that's noteworthy. Demand for x86 servers increased 24.7 percent in 4Q17 with $17.5 billion in revenues. However, non-x86 servers also grew by 36.4 percent year-over-year to $3.2 billion.

Global ICT investment will hit $4 trillion in 2018 – with cloud and hybrid IT infrastructure driving it

Information and communications technology (ICT) is an enabler of economic progress, and a driving force of the Global Networked Economy. Those organizations that have mastered the applications of next-generation technologies are making waves of market disruption everywhere. That said, expect more of the same, at an accelerated pace in future.

Worldwide spending on ICT will be nearly $4 trillion in 2018, according to the latest global market study by International Data Corporation (IDC). Ongoing growth will be driven by enterprise investment on cloud services, software and hybrid IT infrastructure.

Global ICT market development

The consumer market will account for more than $1.5 trillion in ICT spending in 2018 and will deliver more than one third of all worldwide spending throughout the forecast period. Consumer spending will also experience the slowest growth over the forecast period with a CAGR of 1.2 percent. Roughly 80 percent of consumer spending will go to devices and mobile telecom services.

Banking, discrete manufacturing, telecommunications, and professional services will be the four largest industries for ICT spending in 2018 at more than $900 billion combined. While all four industries will invest heavily in applications, infrastructure, outsourcing, and telecom services, spending levels will vary depending on industry needs.

Banking will invest the most in IT outsourcing and project-oriented outsourcing ($115 billion combined) while telecommunications spending will be led by infrastructure purchases ($85 billion). Professional services and banking will experience the fastest growth in ICT spending with five-year CAGRs or 5.9 percent and 5.2 percent, respectively.

The United States will see $1.3 trillion in ICT spending in 2018 making it the largest geographic market this year and throughout the forecast, with spending expected to grow at a CAGR of 3.6 percent. China will be the second largest market for ICT spending at $499 billion this year with solid growth (5.2 percent CAGR) forecast through 2021.

Japan, the UK, and Germany will round out the top five countries for ICT spending in 2018. The countries that will experience the fastest ICT spending growth over the 2016-2021 forecast period are the Philippines (7.5 percent CAGR), India (7 percent CAGR), and Peru (6.7 percent CAGR).

"The growth of technology spending in the U.S. professional services industry is propelled by the tech-savvy firms that comprise it. Meanwhile, banks and retailers share the common desire to deliver a delightful, cohesive, channel-agnostic customer experience. These initiatives are enabled by technology investments to help organizations unite their physical and online worlds," said Jessica Goepfert, program director at IDC.

In terms of company size, the small office category will account for 7 percent all ICT spending throughout the forecast period. Most of this spending (around $100 billion per year) will go toward fixed and mobile telecom services, while devices will also be a significant spending category.

On the other end of the spectrum, very large businesses will account for more than 50 percent of all ICT spending throughout the forecast. These businesses will focus the majority of their spending on IT outsourcing, project-oriented outsourcing, applications, and infrastructure as they pursue their digital transformation strategy.

The spending patterns for small businesses will closely resemble those of the small office category with slightly more spending going toward applications and outsourcing. Medium and large businesses will experience more balanced spending across all technology categories.

Outlook for global IT investments

Spending on information technology (IT) will reach $2.16 trillion this year, led by business and consumer spending on devices, applications, IT outsourcing, and project-oriented outsourcing — including application development and system and network implementation.

In addition, more than $300 billion will be spent on business process outsourcing and business consulting services this year. Telecommunications spending is forecast to be $1.5 trillion this year, with 95 percent of the total going to fixed and mobile telecom services.

Mobile phones will be the largest segment of technology spending at nearly $500 billion in 2018, followed by mobile data and mobile voice at more than $400 billion each.

How hybrid IT demand fuels the multi-cloud computing trend

Guided by senior executive goals for digital transformation, more organizations are increasing their use of cloud computing technologies. The typical multi-cloud mix includes a blend of public cloud, private cloud and traditional IT services. Finding the best-fit service mix starts with the business requirements.

The latest Global Cloud Index (GCI) 2016-2021 from Cisco focuses on the worldwide market outlook for enterprise data centre virtualization and cloud computing services. Today's digital business is enabled by Hybrid IT infrastructure that supports the deployment of cloud-based solutions.

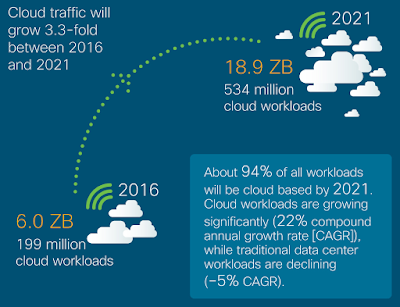
Driven by the surging enthusiasm for digital reinvention projects, data centre traffic is growing fast. The market study authors forecast global cloud data centre traffic will reach 19.5 zettabytes (ZB) per year by 2021 — that's up from 6.0 ZB per year in 2016.

Globally, cloud data centre traffic will represent 95 percent of total data centre traffic by 2021, compared to 88 percent in 2016.

Additionally, according to the Cisco assessment, the growth of Internet of Things (IoT) applications requires scalable server and storage solutions to accommodate new and expanding data centre demands.

By 2021, Cisco expects IoT connections to reach 13.7 billion — that's up from 5.8 billion in 2016.

Hyperscale cloud data centre growth

By 2021 there will be 628 hyperscale data centres globally, compared to 338 in 2016 — that's 1.9-fold growth or near doubling over the forecast period. By 2021, hyperscale data centres will support:

  • 53 percent of all data centre servers (27 percent in 2016)
  • 69 percent of all data centre processing power (41 percent in 2016)
  • 65 percent of all data stored in data centres (51 percent in 2016)
  • 55 percent of all data centre traffic (39 percent in 2016)

Data centre virtualization and cloud growth

By 2021, 94 percent of workloads and compute instances will be processed by cloud data centres. In contrast, 6 percent will be processed by traditional IT data centres.

Overall data centre workloads and compute instances will more than double (2.3-fold) from 2016 to 2021; however, cloud workloads and compute instances will nearly triple (2.7-fold) over the same period.

The workload and compute instance density for cloud data centres was 8.8 in 2016 and will grow to 13.2 by 2021. Comparatively, for traditional data centres, workload and compute instance density was 2.4 in 2016 and will grow to 3.8 by 2021.

Stored data growth fuelled by big data and IoT

Globally, the data stored in data centres will nearly quintuple by 2021 to reach 1.3 ZB by 2021, up 4.6-fold (a CAGR of 36 percent) from 286 EB in 2016.

Big data will reach 403 exabytes (EB) by 2021, up almost 8-fold from 25 EB in 2016. Big data will represent 30 percent of data stored in data centres by 2021, up from 18 percent in 2016.

The amount of data stored on devices will be 4.5 times higher than data stored in data centres, at 5.9 ZB by 2021.

Driven largely by IoT, the total amount of data created (and not necessarily stored) by any device will reach 847 ZB per year by 2021, up from 218 ZB per year in 2016. Data created is two orders of magnitude higher than data stored.

Apps contribute to rise of global data centre traffic

– By 2021, big data will account for 20 percent (2.5 ZB annual, 209 EB monthly) of traffic within data centres, compared to 12 percent (593 EB annual, 49 EB monthly) in 2016.

– By 2021, video streaming will account for 10 percent of traffic within data centres, compared to 9 percent in 2016.

– By 2021, video will account for 85 percent of traffic from data centres to end users, compared to 78 percent in 2016.

– By 2021, search will account for 20 percent of traffic within data centres by 2021, compared to 28 percent in 2016.

– By 2021, social networking will account for 22 percent of traffic within data centres, compared to 20 percent in 2016

SaaS is still the most popular cloud service model

By 2021, 75 percent (402 million) of the total cloud workloads and compute instances will be SaaS workloads and compute instances, up from 71 percent (141 million) in 2016. (23 percent CAGR from 2016 to 2021).

By 2021, 16 percent (85 million) of the total cloud workloads and compute instances will be IaaS workloads and compute instances, down from 21 percent (42 million) in 2016. (15 percent CAGR from 2016 to 2021).

By 2021, 9 percent (46 million) of the total cloud workloads and compute instances will be PaaS workloads and compute instances, up from 8 percent (16 million) in 2016. (23 percent CAGR from 2016 to 2021).

How digital transformation is advancing hybrid multi-cloud

If you're a CTO or CIO that has escalated your organization's move to the cloud, then clearly you're not alone. Worldwide spending on public cloud services and infrastructure is forecast to reach $160 billion in 2018 — that's an increase of 23.2 percent over 2017, according to the latest market study by International Data Corporation (IDC).

Although annual spending growth is expected to slow somewhat over the 2016-2021 forecast period, the market is forecast to achieve a five-year compound annual growth rate (CAGR) of 21.9 percent with public cloud services spending totaling $277 billion in 2021.

Public cloud services market development

The industries that are forecast to spend the most on public cloud services in 2018 are discrete manufacturing ($19.7 billion), professional services ($18.1 billion), and banking ($16.7 billion). The process manufacturing and retail industries are also expected to spend more than $10 billion each on public cloud services in 2018.

These five industries will remain at the top in 2021 due to their continued investment in public cloud solutions. The industries that will see the fastest spending growth over the five-year forecast period are professional services (24.4 percent CAGR), telecommunications (23.3 percent CAGR), and banking (23 percent CAGR).

Software as a service (SaaS) will be the largest cloud computing category, capturing nearly two thirds of all public cloud spending in 2018. SaaS spending, which is comprised of applications and system infrastructure software (SIS), will be dominated by applications purchases, which will make up more than half of all public cloud services spending through 2019.

Enterprise resource management (ERM) applications and customer relationship management (CRM) applications will see the most spending in 2018, followed by collaborative applications and content applications.

Infrastructure as a service (IaaS) will be the second largest category of public cloud spending in 2018, followed by Platform as a service (PaaS). IaaS spending will be fairly balanced throughout the forecast with server spending trending slightly ahead of storage spending.

PaaS spending will be led by data management software, which will see the fastest spending growth (38.1 percent CAGR) over the forecast period. Application platforms, integration and orchestration middleware, and data access, analysis and delivery applications will also see healthy spending levels in 2018 and beyond.

The United States will be the largest country market for public cloud services in 2018 with its $97 billion accounting for more than 60 percent of worldwide spending. The United Kingdom and Germany will lead public cloud spending in Western Europe at $7.9 billion and $7.4 billion respectively, while Japan and China will round out the top 5 countries in 2018 with spending of $5.8 billion and $5.4 billion, respectively.

China will experience the fastest growth in public cloud services spending over the five-year forecast period (43.2 percent CAGR), enabling it to leap ahead of the UK, Germany, and Japan into the number 2 position in 2021. Argentina (39.4 percent CAGR), India (38.9 percent CAGR), and Brazil (37.1 percent CAGR) will also experience particularly strong spending growth.

Outlook for cloud adoption by industry

The U.S. industries that will spend the most on public cloud services in 2018 are discrete manufacturing, professional services, and banking. Together, these three industries will account for roughly one third of all U.S. public cloud services spending this year.

In the UK, the top three industries (banking, retail, and discrete manufacturing) will provide more than 40 percent of all public cloud spending in 2018, while discrete manufacturing, professional services, and process manufacturing will account for more than 40 percent of public cloud spending in Germany.

In Japan, the professional services, discrete manufacturing, and process manufacturing industries will deliver more than 43 percent of all public cloud services. The professional services, discrete manufacturing, and banking industries will represent more than 40 percent of China's public cloud services spending in 2018.

"Digital transformation is driving multi-cloud and hybrid environments for enterprises to create a more agile and cost-effective IT environment in the Asia-Pacific region," said Ashutosh Bisht, research manager at IDC. "Even heavily regulated industries are using SaaS for non-core functionality, platform as a service (PaaS) for app development and testing, and IaaS for workload trial runs and testing for their new service offerings."

Why IT infrastructure trends favour hybrid multi-cloud

Hybrid IT deployments continue to gain favor with CIOs and CTOs, but cloud computing will now drive a greater share of the ongoing investment in business technology. Those combined platforms are enabling digital transformation projects across the globe.

Total spending on IT infrastructure products for deployment in cloud environments reached a total of $46.5 billion in 2017, with year-over-year growth of 20.9 percent, according to the latest worldwide market study by International Data Corporation (IDC).

Cloud infrastructure market development

Public cloud data centers will account for 65.3 percent of this spending, growing at the annual rate of 26.2 percent over the IDC forecast period.

Hosted off-premises private cloud environments will represent 13 percent of cloud IT infrastructure spending, growing at 12.7 percent year-over-year. On-premises private clouds will account for 62.6 percent of spending on private cloud IT infrastructure, and will grow 11.5 percent year-over-year in 2017.

Worldwide spending on traditional – i.e. non-cloud – IT infrastructure is expected to decline by 2.6 percent in 2017, but will still account for 57.2 percent of total spending on IT infrastructure products — that's down slightly from 62.4 percent in 2016.

This trend represents a faster share loss than in the previous three years, according to the IDC assessment. Moreover, the growing share of cloud environments in overall spending on IT infrastructure is common across all regions.

In cloud IT environments, spending in all three technology segments is forecast to grow by double-digits in 2017. Ethernet switches and compute platforms will be the fastest growing at 22.2 percent and 22.1 percent, respectively.

Meanwhile, spending on storage platforms will grow 19.2 percent. Investments in all three technologies will increase across all cloud deployment models – public cloud, private cloud off-premises, and private cloud on-premises.

Outlook for cloud infrastructure investment

Long-term, IDC expects spending on off-premises cloud IT infrastructure will grow at a five-year compound annual growth rate (CAGR) of 12 percent, reaching $51.9 billion in 2021. Public cloud data centres will account for 82.1 percent of this amount growing at a 12.1 percent CAGR while spending on off-premises private cloud infrastructure will increase at a CAGR of 11.7 percent.

Combined with on-premises private cloud, overall spending on cloud IT infrastructure will grow at an 11.7 percent CAGR and by 2020 will surpass spending on non-cloud IT infrastructure. Spending on on-premises private cloud IT infrastructure will grow at a 10.8 percent CAGR, while spending on non-cloud IT (on-premises and off-premises combined) will decline at a 2.7 percent CAGR during the same period.

"As adoption of public cloud services and private cloud deployments continue to spread around the world replacing traditional on-premises hardware-centric IT settings, overall market spending on servers, storage, and networking will follow this move," said Natalya Yezhkova, research director at IDC. "The industry is getting closer to the point when cloud deployments will account for the majority of spending on IT infrastructure, which will be a major milestone embracing the benefits of service-centric IT."

Building blockchain application development expertise: A guide

A cryptocurrency is a digital asset designed to work as a medium of exchange that uses cryptography to secure its transactions, to control the creation of additional units, and to verify the transfer of assets. The quest to discover meaningful commercial applications for blockchain, beyond cryptography apps, has begun across the globe.

451 Research revealed that 28 percent of enterprises are now evaluating or using blockchain, although fewer than 3 percent have any production applications.

Blockchain market development

According to the study, 20 percent of organizations surveyed are using blockchain in a discovery or evaluation phase, 4 percent running trials or pilots, 2 percent in test and development environments, 2 percent undertaking initial implementations of production applications and less than 1 percent have broad implementation of production applications.

Furthermore, the market is rife with vendor misrepresentation about blockchain apps, and there is little understanding about how enterprise leaders can deploy blockchain profitably while navigating a market with thousands of vendors and hundreds of consortia vying for mind-share.

The 451 Research blockchain codex systematically decodes this market, pursuing the goal of replacing confusion and complexity with an examination of the technology components and guidance on first steps.

451 Research analysts believe blockchain has the potential to be the active ingredient for establishing universal trust among parties through clever code and peer-to-peer consensus.

In the enterprise sector, where smart contracts will dictate terms and cloud-tasking using multiple providers is the norm, there will be a need for transparency and an immutable system of record.

At the edge, IoT devices could take advantage of blockchain for authentication and to store and share interactions and data. Numerous other commercial applications will evolve over time.

"Blockchain will do for transactions what the Internet has done for information. It promises to disrupt business models and entire industries. It allows for increased trust and efficiency, and is pushing us to challenge how we define and exchange value and reward participation," said Csilla Zsigri, senior analyst at 451 Research.

Outlook for blockchain application development

With a scarcity of skills in blockchain technology and potential applications, there is a tremendous opportunity for third-party expertise that can help define and support proof of concepts and initial deployments.

More CIOs and CTOs seek information and guidance to gain an understanding of what blockchain is, how it works and how it can be applied in use cases. They're also eager to learn what those organizations and industries at the forefront of this nascent distributed ledger technology have accomplished, thus far.

Read more: IBM ends revenue decline, says it has strengthened cloud and blockchain leadership

Exploring cloud IT infrastructure investment trends for 2018

As 2017 came to a close, IT infrastructure vendors continued to respond to trends that favoured hybrid IT multi-cloud solutions. Most enterprise IT leaders invested in combinations of on-premises platforms and public cloud-based services. Meanwhile, the cloud hyperscale service providers still drive demand.

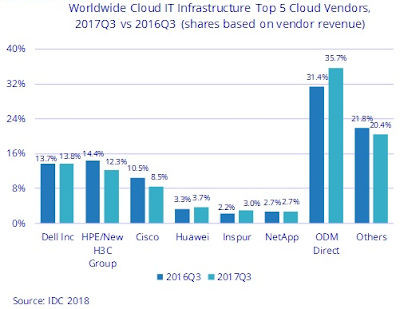
Vendor revenue from sales of infrastructure products (server, storage, and Ethernet switch) for cloud IT — including public and private cloud — grew 25.5 percent year-over-year in the third quarter of 2017 (3Q17) reaching $11.3 billion, according to the latest worldwide market study by International Data Corporation (IDC).

Cloud IT infrastructure market development

Public cloud infrastructure revenue grew 32.3 percent year-over-year in 3Q17 to $7.7 billion and now represents 30.2 percent of total worldwide IT infrastructure spending — that's up from 26.3 percent one year ago.

Private cloud revenue reached $3.6 billion for an annual increase of 13.1 percent. Moreover, total worldwide cloud IT infrastructure revenue is on pace to nearly double in 2017 when compared to 2013.

Traditional (non-cloud) IT infrastructure revenue grew 8 percent from a year ago, although it has been generally declining over the past several years; despite the declining trend, at $14.2 billion in 3Q17 traditional IT still represents 55.6 percent of total worldwide IT infrastructure spending.

Public cloud also represented 68 percent of the total cloud IT infrastructure revenue in 3Q17. The market with the highest growth in the public cloud infrastructure segment was Storage Platforms with revenue up 45.1 percent compared to the same quarter of the previous year, and making up 42 percent of the revenue in public cloud.


Compute platforms and ethernet switch public cloud IT infrastructure revenues were up 24.8 percent and 23.2 percent, respectively.

Compute platforms represented 43.9 percent of public cloud IT infrastructure revenue. Private cloud infrastructure revenue was driven by the storage platforms growth of 16.1 percent year over year.

"2017 has been a strong year for public cloud IT infrastructure growth, accelerating throughout the year," said Kuba Stolarski, research director at IDC.

"While hyperscaler providers are driving the lion's share of the growth, IDC is seeing strong growth in the lower tiers of public cloud and continued growth in private cloud on a worldwide scale."

Outlook for regional cloud growth

Except for Latin America revenue, which grew 5 percent from a year ago, all other regions in the world grew their cloud IT Infrastructure revenue by double digits. The Asia-Pacific region (excluding Japan) and Central and Eastern Europe (CEE) saw the fastest growth rates at 50.1 percent and 35.3 percent, respectively.

Canada (22.5 percent) and Western Europe (24.6 percent) had annual growth in the twenties, while the U.S. (18.7 percent), Japan (17.5 percent), and Middle East & Africa (15.8 percent) had annual growth in the teens. With the outlook for cloud infrastructure investment continuing to experience growth, IDC and other analysts anticipate increased demand for hybrid IT solutions.

How artificial intelligence will drive digital transformation

Ignore the doom and gloom, artificial intelligence (AI) will become a positive job motivator. Moreover, 2020 will be a pivotal year in AI-related employment dynamics, according to the latest worldwide market study by Gartner.

The number of jobs affected by AI will vary by industry. Through 2019, healthcare, the public sector and education will see continuously growing job demand, while manufacturing will be negatively impacted. Starting in 2020, AI-related job creation will cross into positive territory, reaching two million net-new jobs in 2025.

Artificial intelligence market development

"Many significant innovations in the past have been associated with a transition period of temporary job loss, followed by recovery, then business transformation and AI will likely follow this route," said Svetlana Sicular, research vice president at Gartner.

AI will improve the productivity of many jobs, eliminating millions of middle- and low-level positions, but also creating millions more new positions of highly skilled, management and even the entry-level and low-skilled variety.

Unfortunately, most calamitous warnings of job losses confuse AI with automation, that overshadows the greatest benefit from the technology — AI augmentation — which is a combination of human and artificial intelligence, where both can complement each other.

IT leaders should not only focus on the projected net increase of jobs. With each investment in AI-enabled technologies, they must take into consideration what jobs will be lost, what jobs will be created, and how it will transform the way workers collaborate with others, and make decisions.

"Now is the time to really impact your long-term AI direction," said Ms. Sicular. "For the greatest value, focus on augmenting people with AI. Enrich people's jobs, re-imagine old tasks and create new industries. Transform your culture to make it rapidly adaptable to AI-related opportunities or threats."

Gartner identified additional predictions for AI:

  • AI has already been applied to highly repeatable tasks where large quantities of observations and decisions can be analyzed for patterns.
  • However, applying AI to less-routine work that is more varied due to lower repeatability will soon start yielding superior benefits.
  • AI applied to non-routine work is more likely to assist humans than replace them as combinations of humans and machines will perform more effectively than either human experts or AI-driven machines working alone will.
  • By 2022, one in five workers engaged in mostly non-routine tasks will rely on AI to do a job.
  • Through 2022, multi-channel retailer efforts to replace sales associates through AI will prove unsuccessful, although cashier and operational jobs will be disrupted.
  • In 2021, AI augmentation will generate $2.9 trillion in business value and recover 6.2 billion hours of worker productivity.

"AI can take on repetitive and mundane tasks, freeing up humans for other activities, but the symbiosis of humans with AI will be more nuanced and will require reinvestment and reinvention instead of simply automating existing practices," said Mike Rollings, research vice president at Gartner.

Rather than have a machine replicating the steps that a human performs to reach a particular judgment, the entire decision process can be refactored to use the relative strengths and weaknesses of both machine and human to maximize value generation and redistribute decision making to increase agility.

Editor's note: Read more about artificial intelligence on our sister publication, AI News.

How more industry cloud services are gaining momentum in 2017

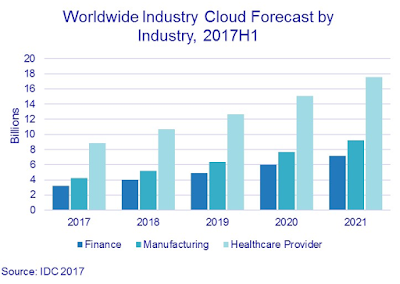
Worldwide spending on industry cloud services in the finance sector – such as banking, insurance, securities and investment services – is expected to reach $3.2 billion in 2017, according to the latest market study by International Data Corporation (IDC).

Furthermore, IDC expects the amount to more than double in 2021, amassing total worldwide spending of $7.2 billion.

Industry cloud market development

The manufacturing industry (both discrete and process combined) was a larger spender on industry cloud though, relative to its finance counterpart. This industry is expected to spend $4.2 billion in 2017 and achieve year-over-year growth of 23 percent in 2018. Similar to the finance industry, the manufacturing industry is also set to double its 2017 spending in 2021, reaching a total of $9.2 billion.

However, IDC forecasts healthcare providers across the world will spend a total of $8.9 billion in adopting industry cloud solutions during 2017. This industry is expected to increase spending by 20 percent year-over-year in 2018 on industry cloud solutions – by 2021, that's a staggering $17.6 billion.

On a geographic basis, the United States leads by a very large margin in terms of industry cloud adoption across the three aforementioned industries combined. It's expected to reach 73 percent of worldwide spend in 2017, followed by Western Europe at 12 percent.

The U.S. is also forecast to grow 20 percent year-over-year in 2018 while the other regions are expected to achieve 27 percent annual growth during the same period. The three industries are expected to spend a total of $330 million on industry cloud solutions in China in 2018, representing very strong growth of 39 percent year-over-year.

"The industry cloud market is young, yet growing fast, with double-digit growth expected to continue for at least the next five to ten years. Dozens of new industry collaborative clouds are emerging each year, helping to foster digital transformation, streamline industry value chains, and ultimately drive innovation, while most software vendors are also shifting their portfolios to focus more heavily on designing industry cloud solutions," said Eric Newmark, program vice president at IDC.

Outlook for vertical industry cloud growth

Healthcare continues to lead the charge from a vertical standpoint, but many industries have picked up momentum, including manufacturing, financial services, and even government.

Though the market's tipping point is still a few years away, IDC believes the industry cloud market represents one of the largest vertical growth opportunities for technology and professional services firms through 2025.

According to the IDC assessment, IT vendors who become strategic suppliers to a successful industry cloud win the business of not just that one organization, but of that customer's entire digital ecosystem.