All posts by louiscolumbus

40% of SaaS companies use AWS to deliver their apps, according to Pacific Quest

(c)iStock.com/alexsl

  • 40% of SaaS companies are using Amazon Web Services (AWS) to deliver their apps today.
  • Median subscription gross margins for SaaS companies in 2015 are 78%.
  • Overall, SaaS companies are projecting median revenue growth of 46% in 2015.
  • Channel sales and inside sales strategies delivered the highest revenue growth rates in 2014.
  • Companies in the $5M – $7.5M range achieved 70% revenue growth in 2014, surpassing the median 36% growth rate last year.

These and many other insights are from the 2015 Pacific Crest SaaS Survey published by David Skok of Matrix Partners in collaboration with Pacific Crest Securities. You can download a free copy of Part I of the study here (PDF, opt-in, 72 pp).

305 SaaS companies were interviewed, 31% from international locations and 69% from North America.  David Skok and Pacific Crest Securities will publish Part 2 of the results in the near future. SaaS Metrics 2.0 – Detailed Definitions provides a useful reference for many of the SaaS metrics mentioned in the study.

This year’s survey attracted an eclectic base of respondents, with median revenues of $4M a year, with 133 companies reporting less than $5M, and 57 over $25M. Annual Contract Value (ACV) across all respondents is $21K, with 17% of respondents reporting ACVs over $100K.  Please see pages 3 & 4 of the study for a description of the methodology. Key takeaways from the study include the following:

  • SaaS GAAP revenue growth is accelerating in 2014 and is projected to increase further in 2015 from 44% to 46%. Median revenue growth in 2014 for all survey respondents was 44%, with the aggregate projected growth for 2015 reaching 46%. When SaaS companies with less than $2.5M in revenues are excluded, median GAAP growth was 35% in 2014 and is expected to reach that same level in 2015.

grow SaaS Revenue


  • SaaS companies with mixed customer strategies are growing at 57% a year.  Excluding respondent companies with less than $2.5M in revenues, a mixed customer strategy dominates all others. Concentrating on enterprises and small & medium businesses (SMBs) both drove 33% revenue growth of respondent companies this year.

median growth rate as a function of customer


  • 40% of SaaS companies are using Amazon Web Services (AWS) to deliver their apps today. AWS is projected to increase to 44% three years from now, with Microsoft Azure increasing from 3% today to 6% in 3 years.

SaaS Delivered


  • 41% of all SaaS companies surveyed rely primarily on field sales.  Factoring out the companies with less than $2.5M in revenue, field sales accounts for 32%.

primary mode of distribution


  • Field sales dominates as the most effective sales strategy when median deal sizes are $50K or more. In contrast, inside sales dominates $5K to $15K deal sizes, and the Internet dominates deal sizes less than $1K.  The following graphic provides insights into the primary mode of sales by median initial contract size.

mode by initial contract size


  • 16% of new Average Contract Value (ACV) sales is from upsells, with the largest companies being the most effective at this selling strategy. One of the strongest catalysts of a SaaS companies’ growth is the ability to upsell customers to a higher ACV, generating significantly greater gross margin in the process. SaaS companies with revenues between $40M to $75M increase their ACV by 32% using upsells. Larger SaaS companies with over $75M in sales generate 28% additional ACV with upsell strategies.

ACV Value


  • The highest growth SaaS companies are relying on upsells to fuel higher ACV.  There is a significant difference between the highest and lowest growth SaaS companies when it comes to upsell expertise and execution.  The following graphic provides an overview by 2014 GAAP revenue category of percent of ACV attributable to upsells.

fast upsell


  • 60% are driving revenues with “Try Before You Buy” strategies, with 30% generating the majority of their revenues using this approach.  On contrast, only 30% of companies generate revenues and ACV from freemium.

freemium

The hottest cloud-based marketing startups of 2015

(c)iStock.com/ataken

  • Apttus, Booker, Lattice Engines, Segment and Tubular Labs are the five hottest cloud-based marketing startups of 2015.
  • 13 of the hottest 34 cloud-based marketing startups are from the Bay Area, followed by Los Angeles with 3, and Bangalore and New York, both with 2.
  • 14 are in Pre Series A, 7 in A-Stage, 5 in B-Stage and 3 in C-Stage funding rounds.

These and other insights are from a quick analysis completed using Mattermark Pro, in response to reader requests for more research on marketing startups.

Mattermark uses a combination of artificial intelligence and data quality analysis to provide insights into over one million private companies, over 470,000 with employee data, and over 100,000 funding events. In the interest of full disclosure I’m not today and have never done any consulting work of any kind with Mattermark.

Finding the hottest cloud-based marketing startups

To find the hottest cloud-based marketing startups, an initial query requesting startups competing in the cloud computing and marketing industries was completed. Next, advanced query tools in Mattermark Pro were used to filter out all startups that had exited as indicated by their stage status in Mattermark’s data. This filtered out startups who had been acquired, completed an IPO or had exited through other means. The table below is the result of an analysis completed today with Mattermark data.  You can download the table here in Microsoft Excel format.

hottest cloud-based marketing startups

The Mattermark Growth Score shown in the table below and downloadable Excel file is a measure of how quickly a company is gaining traction at a given point in time. It incorporates the Mindshare Score (web traffic, social traction) as well as business growth metrics (e.g. employee count over time, funding).

The underlying assumption is that companies who see growth across these signals are shipping product and talking to customers, and are more likely to continue to grow as a result. This score is not meant to provide guidance on which startup to invest in.  Rather it’s a measure of momentum across the metrics and KPIs that Mattermark measures.

2015 big data market update: Enterprise use cases and moving from traditional databases

(c)iStock.com/sorbetto

  • 42.6% of all big data apps developed for manufacturing are being created by enterprises today.
  • 38.2% of all big data and advanced analytics apps in use today are in customer-facing departments including marketing, sales, and customer service.
  • 33.2% of all big data and advanced analytics developers are concentrating on the software & computing industry.
  • 19.2% of big data app developers say quality of data is the biggest problem they consistently face when building new apps.

These and other insights are from the recently published report Big Data and Advanced Analytics Survey 2015, Volume I by Evans Data Corporation. The survey is based on 444 in-depth interviews with developers who are currently working with analytics and databases and are both currently working on and planning big data and advanced analytics projects. The survey’s results provide a strategic view of the attitudes, adoption patterns and intentions of developers in relation to big data and analytics. You can more on the methodology of the report here.

Key takeaways from the report include the following:

  • Software & computing (18%), financial (11.6%), manufacturing (10.9%) and retail (9.8%) industries have the highest percentage of programmers creating big data and analytics applications today.  Additional industries where big data app development is active and growing include entertainment (7.7%), telecommunications (7.5%), utilities & energy (6.6%) and healthcare (4.6%). The following graphic provides an overview of the industries addressed.

industries addressed

  • Capturing more information than traditional database practices (22.60%), capturing and analyzing unstructured data (21.10%) and the potential for visualizing or analysing data differently (20.70%) are the three top use cases driving app development today.  Evans Data found that capturing more information than traditional database practices allow increased 6% since last year, making it the top use case in 2015. The following graphic provides the distribution of responses by use cases from the developers surveyed.

top three use cases

  • Total size of the data being processed (40.8%), complex, unstructured nature of the data (38.1%) and the need for real-time data analysis (17.7%) are the top three factors driving big data adoption over traditional database solutions.  Evans Data found that the size and complexity of structured and unstructured data is the catalyst that gets enterprises moving on the journey to big data adoption. The ability to gain greater insights into their data with descriptive, predictive and contextually-driven analytics is the fuel that keeps big data adoption moving forward in all companies.

reasons to move to big data

  • 33.2% of all big data and advanced analytics developers are concentrating on the software & computing industry. Of these developers, 36.7% are working in organisations of 101 to 1,000 employees, 32.9% are in enterprises of 1,000+ employees, and 30.1% are in organisations of 100 employees or less. 42.6% of all big data software development in manufacturing begins in enterprises (1K+ employees).

Industries being targeted by big data by company size


  • Enterprises competing in the software & computing industry (17.5%), manufacturing (15.8%) and financial industry (14%) are investing the heaviest in big data and analytics app development. Overall, 32% of big data and analytics projects are custom-designed and produced by system integrators and value-added resellers (SI, VAR). 70% of big data and advanced analytics apps for manufacturing are created by enterprise and system integrator/value-added reseller (SI/VAR) development teams.  The following graphic provides an overview of industries targeted by big data, segmented by developer segment.

industries being targeted by big data by developer segment


  • Sales and customer data (9.6%), IT-based data analysis (9.4%), informatics (8.7%) and financial transactions (8.4%) are the most common big data sets app developers are working with today.  In addition marketing, system management, production and shop floor data, and web & social media-generated data are also included.  Evans Data found that informatics data sets grew the fastest in the last six months, and scientific computing is now competing with transaction processing systems as a dominant data set developers rely on to create new apps.

kinds of information that feed your company's data stores

  • Marketing departments have quickly become the most common users of big data and advanced analytics apps (14.4%) followed by IT (13.3%) and Research & Development (13%). Evans Data asked developers which departments in their organizations are putting big data and advanced analytics apps to use, regardless of where they were created.  38.2% of all big data use in organizations today are in customer-facing departments including marketing, sales, and customer service.

departments using analytics and big data

  • Availability of relevant tools (10.9%), storage costs (10.2%) and siloed business, IT, and analytics/data science teams (10.0%) are the top three barriers developers face in building new apps. It’s interesting to note that compliance and having to transition from legacy systems did not score higher in the survey, as these two areas are inordinately more complex in more regulated, older industries.  For big data and advanced analytics to accelerate across manufacturing and financial industries, compliance and legacy systems integration barriers will need to first be addressed.

three barriers

  • Quality of data (19.2%), relevance of data being acquired (13.5%), volume of data being processed (12.6%) and ability to adequately visualise big data (11.7%) are the four biggest problem areas faced by big data developers today.  Additional problem areas include the volume of data in storage (10.5%), ability to gain insight from big data (10.1%) and the high rate of data acquisition (7.6%).  The remainder of problem areas are shown in the graphic below.   

biggest problem

  • Providing real-time correlation and anomaly detection of diverse security data (29.9%) and high-speed querying of security intelligence data (28.1%) are the two most critical areas vendors can assist developers with today. Big data and analytics app developers are looking to vendors to also provide more effective security algorithms for various use case scenarios (17.6%), flexible big data analytics across structured and unstructured data (14.2%) and more useful graphical front-end tools for visualising and exploring big data (5.1%).

vendor provide

A roundup of cloud computing forecasts and market estimates for Q315

(c)iStock.com/Barcin

  • The global SaaS market is projected to grow from $49B in 2015 to $67B in 2018, attaining a CAGR of 8.14%.
  • Global spending on Infrastructure-as-a-Service (IaaS) is expected to reach $16.5B this year, an increase of 32.8% from 2014.
  • Cloud applications will account for 90% of worldwide mobile data traffic by 2019, compared to 81% at the end of last year.

These and other insights are from recent cloud computing forecasts and market estimates published by research and advisory consultancies including International Data Corporation (IDC), Forrester, Gartner, Ovum, Wikibon and others.

While the methodologies differ significantly, the findings from a recent Economist Intelligence Unit study provide the galvanizing thread across this diverse set of data.  The Economist found that the most mature enterprises are now turning to cloud strategies as a strategic platform for growing customer demand and expanding sales channels. The study found low-maturity or lagging cloud adopters focus on costs more than growth.

Key take-aways from the round-up are provided below:

cloud mobile data

  • 57% of IT architects and tech professionals are running apps on the Amazon Web Services (AWS) platform today.  Rightscale’s 2015 State of the Cloud Report found that AWS adoption is over 4X greater than Microsoft Azure IaaS and 5X that of Rackspace Public Cloud.  Rightscale found that AWS, Microsoft Azure IaaS, Azure PaaS, Rackspace Public Cloud and VMWare vCloud Air are the top five public cloud platforms used in enterprises today. Source: RightScale 2015 State Of The Cloud Report

Public Cloud Usage

paas market trends

PaaS Market Share

  • Goldman Sachs is forecasting the cloud infrastructure and platform market will grow at a 19.62% CAGR from 2015 to 2018, reaching $43B by 2018. Their recent market analysis also forecasts that the global market for cloud infrastructure and platforms will grow from $21B this year to $43B by the end of the forecast period.  Source:  How Big Can The Amazon Web Services Business Grow In The Future?

goldman sachs cloud computing

IaaS Market Window

cloud maturity

hosted private cloud computing adoption

  • 46% of surveyed firms in the European Union (EU) are using advanced cloud services relating to financial and accounting software applications, customer relationship management or to the use of computing power to run business applications. In 2014, almost twice as many firms used public cloud servers (12%) versus private cloud servers (7%). The following graphic illustrates the degree of dependence on cloud computing, by economic activity, EU-28, 2014. Source: Eurostat Statistics Explained.  Cloud computing – statistics on the use by enterprises.

degree of dependence

  • 64% of Small & Medium Businesses (SMBs) are already using cloud-based apps, with average adoption being 3 apps.  78% of businesses indicate that they are considering purchasing new solutions in the next 2-3 years creating the potential to move the average number of applications used to 7, with 88% consuming at least one service.  Source: The small business revolution: trends in SMB cloud adoption.

cool infographic

  • Worldwide spending on enterprise application software will grow 7.5% to reach $149.9B in 2015, increasing to more than $201B in 2019 with accelerating cloud adoption driving new software sales. Gartner’s analysis of enterprise software spending shows that alternative consumption models to traditional on-premises licenses are accounting for more than 50% of new software implementations; these include SaaS, hosted license, on-premises subscriptions and open source.  Gartner also predicts that by 2020, about a quarter of organizations in emerging regions will run their core CRM systems in the cloud, up from around 10 percent in 2012. Source: Gartner Says Modernization and Digital Transformation Projects Are Behind Growth in Enterprise Application Software Market.

Cloud computing dominates Deloitte’s 2015 global venture capital confidence survey

(c)iStock.com/cherezoff

  • Cloud computing is the strongest technology investment sector for the third year in a row.
  • Biopharmaceuticals and robotics are the two sectors that have gained the greatest venture capital confidence from 2014 to 2015.
  • U.S. technology hubs (Silicon Valley/San Francisco, New York, Boston, Los Angeles & Chicago), Israel and Canada dominate while confidence continues to fall in Brazil and other emerging markets.

These and other insights are from Deloitte’s 2015 Global Venture Capital Confidence Survey.  You can download a copy here (PDF, no opt-in, 70 pp.).  Deloitte has also produced and made available infographics of the key findings here (PDF, no opt-in, 4 pp.).

Deloitte & Touche LLP and the National Venture Capital Association (NVCA) collaborated on the eleventh annual survey, which was conducted in May & June of this year. The study assesses investor confidence in the global venture capital environment, market factors shaping industries and investments on specific geographies and industry sectors. See page 4 of the study for a description of the methodology.

Key takeaways include the following:

  • Global venture capital investors are most confident in cloud computing (4.18). Investors were asked to rate their confidence level in each sector. Confidence levels were measured on a scale of 1 to 5, with 5 representing the most confidence. Basis points indicate year-over-year changes. Mobile (4.05), Internet of Things (3.95) and enterprise software (3.82) are the top four sectors venture capitalists are the most confident in today. Biopharmaceuticals are experiencing the greatest increase in venture capital confidence today.  Please the the graphic below for additional details.

cloud growth

  • The United States (4.17), Israel (3.90) and Canada (3.60) dominate venture capital investors’ confidence while emerging markets including Brazil continues to fall. U.S. technology hubs including Silicon Valley/San Francisco, New York, Boston, Los Angeles and Chicago continue to retain and reinforce global venture capital investor confidence.  The following graphic illustrates global venture capital investor’s confidence by nation.

globe

  • Silicon Valley/San Francisco (4.28), New York (3.86) and Boston (3.77) are the top three U.S. metros global venture capital investors have the greatest confidence in.  Los Angeles (3.43) and Chicago (3.22) are the fourth and fifth most trusted U.S. metros that venture capitalists have confidence in.  $15.2B was invested by global venture capital investors in Silicon Valley/San Francisco according to the Deloitte study.  The following graphic compares venture capitalist confidence levels and venture capital investment dollars received in 2015 through Q2.

US Metro

  •  Immigration reform (61%) and patent demand reform (36%) are the top two  initiatives U.S.-based venture capitalists want addressed by policy leaders.  For non-U.S. venture capitalists, tax incentives/credits (50%), infrastructure and job creation (both 41%) are the top two initiatives they would like to see public policy leaders take on in their home country.

top two

  • Cloud computing continues across all sectors as the area global venture capital investors have the greatest confidence in.  Confidence in biopharmaceuticals grew the fastest of any sector measured by the survey between 2014 and 2015, and this is the first year Deloitte is tracking investor confidence in the Internet of Things (IoT).  A sector comparison is provided below.

sector investing

10 ways big data is revolutionising supply chain management

(c)iStock.com/Сергей Хакимуллин

Big data is providing supplier networks with greater data accuracy, clarity, and insights, leading to more contextual intelligence shared across supply chains.

Forward-thinking manufacturers are orchestrating 80% or more of their supplier network activity outside their four walls, using big data and cloud-based technologies to get beyond the constraints of legacy enterprise resource planning (ERP) and supply chain management (SCM) systems. For manufacturers whose business models are based on rapid product lifecycles and speed, legacy ERP systems are a bottleneck.  Designed for delivering order, shipment and transactional data, these systems aren’t capable of scaling to meet the challenges supply chains face today.

Choosing to compete on accuracy, speed and quality forces supplier networks to get to a level of contextual intelligence not possible with legacy ERP and SCM systems. While many companies today haven’t yet adopted big data into their supply chain operations, these ten factors taken together will be the catalyst that get many moving on their journey.

The ten ways big data is revolutionising supply chain management include:

Figure 1 SCM Data Volume Velocity Variety

  • Enabling more complex supplier networks that focus on knowledge sharing and collaboration as the value-add over just completing transactions.  Big data is revolutionising how supplier networks form, grow, proliferate into new markets and mature over time. Transactions aren’t the only goal, creating knowledge-sharing networks is, based on the insights gained from big data analytics. The following graphic from Business Ecosystems Come Of Age (Deloitte University Press) (free, no opt-in) illustrates the progression of supply chains from networks or webs, where knowledge sharing becomes a priority.

figure 1 big data scm

  • Big data and advanced analytics are being integrated into optimisation tools, demand forecasting, integrated business planning and supplier collaboration & risk analytics at a quickening pace. These are the top four supply chain capabilities that Delotte found are currently in use form their recent study, Supply Chain Talent of the Future Findings from the 3rd Annual Supply Chain Survey (free, no opt-in). Control tower analytics and visualization are also on the roadmaps of supply chain teams currently running big data pilots.

Figure 2 use of supply chain capabilities

  • 64% of supply chain executives consider big data analytics a disruptive and important technology, setting the foundation for long-term change management in their organizations.  SCM World’s latest Chief Supply Chain Officer Report provides a prioritisation of the most disruptive technologies for supply chains as defined by the organisations’ members.  The following graphic from the report provides insights into how senior supply chain executives are prioritizing big data analytics over other technologies.

disruptive tech

  • Using geoanalytics based on big data to merge and optimise delivery networks.  The Boston Consulting Group provides insights into how big data is being put to use in supply chain management in the article Making Big Data Work: Supply Chain Management (free, opt-in). One of the examples provided is how the merger of two delivery networks was orchestrated and optimized using geoanalytics. The following graphic is from the article. Combining geoanalytics and big data sets could drastically reduce cable TV tech wait times and driving up service accuracy, fixing one of the most well-known service challenges of companies in that business.

Figure 4 geoanalytics

figure 6 big data


figure 7 big data

  • Greater contextual intelligence of how supply chain tactics, strategies and operations are influencing financial objectives.  Supply chain visibility often refers to being able to see multiple supplier layers deep into a supply network.  It’s been my experience that being able to track financial outcomes of supply chain decisions back to financial objectives is attainable, and with big data app integration to financial systems, very effective in industries with rapid inventory turns. Source: Turn Big Data Into Big Visibility.

figure 8 traceability

  • Traceability and recalls are by nature data-intensive, making big data’s contribution potentially significant. Big data has the potential to provide improved traceability performance and reduce the thousands of hours lost just trying to access, integrate and manage product databases that provide data on where products are in the field needing to be recalled or retrofitted.
  • Increasing supplier quality from supplier audit to inbound inspection and final assembly with big data. IBM has developed a quality early-warning system that detects and then defines a prioritisation framework that isolates quality problem faster than more traditional methods, including Statistical Process Control (SPC). The early-warning system is deployed upstream of suppliers and extends out to products in the field.

55% of enterprises predict cloud computing will enable new business models in three years

(c)iStock.com/4774344sean

In late 2014, Oxford Economics and SAP collaborated on a survey of 200 senior business and IT executives globally regarding the adoption and use of cloud technology:

  • 69% of enterprises expect to make moderate-to-heavy cloud investments over the next three years as they migrate core business functions to the cloud.
  • 44% of enterprises are relying on cloud computing to launch new business models today, predicting this will increase to 55% in three years.
  • 32% are using cloud computing to streamline their supply chains today. Senior executives predict this figure will increase to 56% in three years, a 24% increase.
  • 59% say they use cloud-based applications and platforms to better manage and analyze data today, reflecting the increasing importance of analytics and big data enterprise-wide.

These and other insights are from The Cloud Grows Up. You can find the study here (no opt-in).  Oxford Economics’ analysts compared the latest survey with one completed in 2012 looking for leading indicators of cloud adoption in enterprises. They found many C- and VP-level executives are taking a more pragmatic, realistic view of what cloud technologies can contribute. Enterprises are moving beyond the hype of cloud computing, putting in the hard work of launching new business models while driving top-line revenue growth.

Oxford Economics has made two interactive infographics available from the study here. The first details cloud adoption, and the second, on how enterprises see cloud computing changing their business models over the next three years.  As cloud platforms and applications become a scalable, secure and for the most part reliable, once-elusive enterprise goals and new business models become attainable.

Key takeaways from the study include the following:

  • Top–line growth (58%), collaboration among employees (58%), and supply chain (56%) are the three areas enterprises expect cloud computing to impact most in three years. The greatest gains will be in the areas of supply chain (a 24% jump), collaboration among employees (20%) and increased agility and responsiveness to customers (17%). The following graphic compares where enterprises are seeing cloud computing’s impact today and a prediction of each areas’ impact in three years.

Figure 2

  • Developing new products & services (61%), new lines of business (51%) and entering new markets (40%) are three key areas cloud computing is transforming enterprises.  With a 35% increase, developing new products and services is the most dominant strategy enterprises are relying on to grow their businesses. See the comparison below for further details.       

developed new services using cloud computing 2

  • 58% of enterprises predict their use of cloud computing will increase top-line revenue growth in three years. 67% see the cloud changing skill sets and transforming the role of HR. The following graphic illustrates the first of two interactive infographics Oxford Economics and SAP are providing with the report. You can access the infographic here.

clouds enduring promise

  • 74% of enterprises say innovation and R&D is somewhat or mostly cloud-based. 61% say they will have developed new products and services in three years as a result of adopting cloud technologies.  The following graphic illustrates the second of two interactive infographics Oxford Economics and SAP are providing with the report. You can access the infographic here.

infographic the cloud grows up

  • Enterprise cloud security strategies are maturing rapidly. From 2012 to 2014, strategies for ensuring the security of API and interfaces increased 24%, from 20% to 44%. Additional concerns that increased include virus attacks (up 19%), and identity theft (up 16%).  The following figure compares the top concerns enterprises have in the area of cloud security.

cloud security

  • 31% of respondents say the cloud computing has had a transformative impact on their business.  48%, nearly half, state that cloud computing has had a moderate impact on business performance. The majority believe cloud computing will have a significant impact on top-line revenue growth in three years.

Figure 31

  • 67% of enterprises say that marketing, purchasing, and supply chain are somewhat and mostly cloud-based as of today. Cloud-based adoption has reached an inflection point in enterprises, with functional areas having the largest percentage of workloads running on cloud-based apps. Enterprise senior executives see the potential to improve innovation, R&D, and time-to-market via greater collaboration using cloud technologies.

A 2015 roundup of analytics, big data and business intelligence forecasts

(c)iStock.com/alexsl

Despite the varying methodologies used in the studies mentioned in this roundup, many share a common set of conclusions. The high priority in gaining greater insights into customers and their unmet needs, more precise information on how to best manage and simplify sales cycles, and how to streamline service are common themes.

  • Salesforce (NYSE:CRM) estimates adding analytics and Business Intelligence (BI) applications will increase their Total Addressable Market (TAM) by $13B in FY2014.
  • 89% of business leaders believe Big Data will revolutionize business operations in the same way the Internet did.
  • 83% have pursued Big Data projects in order to seize a competitive edge.

The most successful Big Data uses cases revolve around enterprises’ need to get beyond the constraints that hold them back from being more attentive and responsive to customers.

Presented below is a roundup of recent forecasts and estimates:

  • Wikibon projects the Big Data market will top $84B in 2026, attaining a 17% Compound Annual Growth Rate (CAGR) for the forecast period 2011 to 2026. The Big Data market reached $27.36B in 2014, up from $19.6B in 2013. These and other insights are from Wikibon’s excellent research of Big Data market adoption and growth. The graphic below provides an overview of their Big Data Market Forecast.  Source: Executive Summary: Big Data Vendor Revenue and Market Forecast, 2011-2026.

Wikibon big data forecast

  • IBM and SAS are the leaders of the Big Data predictive analytics market according to the latest Forrester Wave™: Big Data Predictive Analytics Solutions, Q2 2015. The latest Forrester Wave is based on an analysis of 13 different big data predictive analytics providers including Alpine Data Labs, Alteryx, Angoss Software, Dell, FICO, IBM, KNIME.com, Microsoft, Oracle, Predixion Software, RapidMiner, SAP, and SAS. Forrester specifically called out Microsoft Azure Learning is an impressive new entrant that shows the potential for Microsoft to be a significant player in this market. Gregory Piatetsky (@KDNuggets) has done an excellent analysis of the Forrester Wave Big Data Predictive Analytics Solutions Q2 2015 report here. Source: Courtesy of Predixion Software: The Forrester Wave™: Big Data Predictive Analytics Solutions, Q2 2015 (free, no opt-in).

Forrester Wave Big Data Predictive Analytics

  • IBM, KNIME, RapidMiner and SAS are leading the advanced analytics platform market according to Gartner’s latest Magic Quadrant. Gartner’s latest Magic Quadrant for advanced analytics evaluated 16 leading providers of advanced analytics platforms that are used to building solutions from scratch. The following vendors were included in Gartner’s analysis: Alpine Data Labs, Alteryx, Angoss, Dell, FICO, IBM, KNIME, Microsoft, Predixion, Prognoz, RapidMiner, Revolution Analytics, Salford Systems, SAP, SAS and Tibco Software, Gregory Piatetsky (@KDNuggets) provides excellent insights into shifts in Magic Quadrant for Advanced Platform rankings here.  Source: Courtesy of RapidMinerMagic Quadrant for Advanced Analytics Platforms Published: 19 February 2015 Analyst(s): Gareth Herschel, Alexander Linden, Lisa Kart (reprint; free, no opt-in).

Magic Quadrant for Advanced Analytics Platforms

  • Salesforce estimates adding analytics and Business Intelligence (BI) applications will increase their Total Addressable Market (TAM) by $13B in FY2014. Adding new apps in analytics is projected to increase their TAM to $82B for calendar year (CY) 2018, fueling an 11% CAGR in their total addressable market from CY 2013 to 2018. Source: Building on Fifteen Years of Customer Success Salesforce Analyst Day 2014 Presentation (free, no opt in).

Salesforce Graphic

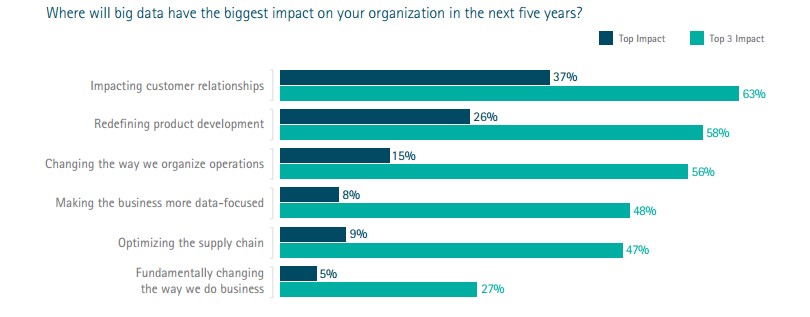
  • 89% of business leaders believe big data will revolutionize business operations in the same way the Internet did. 85% believe that big data will dramatically change the way they do business. 79% agree that ‘companies that do not embrace Big Data will lose their competitive position and may even face extinction.’ 83% have pursued big data projects in order to seize a competitive edge. The top three areas where big data will make an impact in their operations include: impacting customer relationships (37%); redefining product development (26%); and changing the way operations is organized (15%).The following graphic compares the top six areas where big data is projected to have the greatest impact in organizations over the next five years. Source: Accenture, Big Success with Big Data: Executive Summary (free, no opt in).

Big Data Big Success Graphic

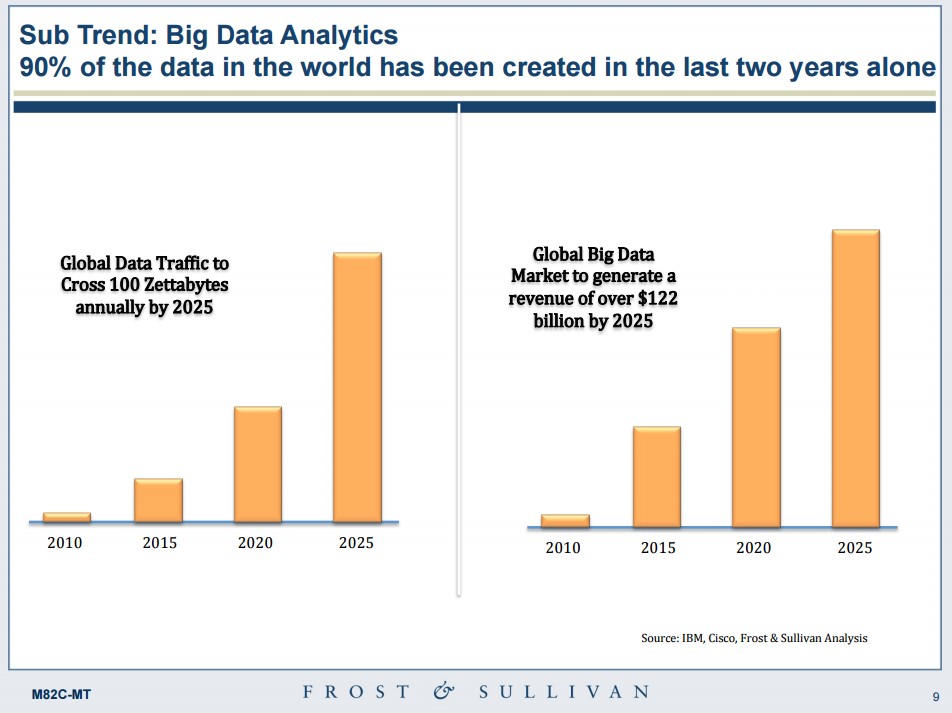
Frost & Sullivan Graphic


global text market graphic

  • Customer analytics (48%), operational analytics (21%), and fraud & compliance (21%) are the top three use cases for Big Data. Datameer’s analysis of the market also found that the global Hadoop market will grow from $1.5B in 2012 to $50.2B in 2020, and financial services, technology and telecommunications are the leading industries using big data solutions today. Source: Big Data: A Competitive Weapon for the Enterprise.

Big Data Use Cases in Business

  • 37% of Asia Pacific manufacturers are using Big Data and analytics technologies to improve production quality management. IDC found manufacturers in this region are relying on these technologies to reduce costs, increase productivity, and attract new customers. Source: Big Data and Analytics Core to Nex-Gen Manufacturing.

big data in manufacturing

  • Supply chain visibility (56%), geo-location and mapping data (47%) and product traceability data (42%) are the top three potential areas of Big Data opportunity for supply chain management. Transport management, supply chain planning, & network modeling and optimization are the three most popular applications of Big Data in supply chain initiatives. Source: Supply Chain Report, February 2015.

Big data use in supply chains

  • Finding correlations across multiple disparate data sources (48%), predicting customer behavior (46%) and predicting product or services sales (40%) are the three factors driving interest in Big Data analytics. These and other fascinating findings from InformationWeek’s 2015 Analytics & BI Survey provide a glimpse into how enterprises are selecting analytics applications and platforms. Source: Information Week 2015 Analytics & BI Survey.

factors driving interest in big data analysis

Gartner does not endorse any vendor, product or service depicted in its research publications, and does not advise technology users to select only those vendors with the highest ratings. Gartner research publications consist of the opinions of Gartner’s research organization and should not be construed as statements of fact. Gartner disclaims all warranties, expressed or implied, with respect to this research, including any warranties of merchantability or fitness for a particular purpose.

Five ways cloud service providers are making manufacturers more competitive

(c)iStock.com/.shock

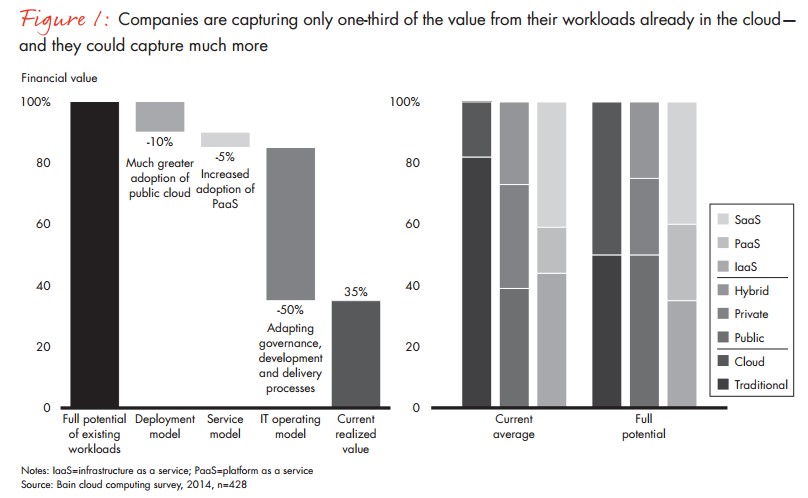
Enterprises are only realizing 35% of the total potential value of their cloud deployments according to a recent Bain & Company study. Companies that moved development to IaaS and PaaS clouds from Amazon Web Services (AWS) reduced downtime by 72% and improved application availability by 3.9 hours per user per year.

These and other key takeaways are from the recent Bain & Company study, Tapping Cloud’s Full Potential. The full report PDF is available for download here (free, no opt-in). The following graphic from the report illustrates the currently realized value of cloud deployments in enterprises today according to Bain & Company.

Capturing only one-third of the value of their workloads

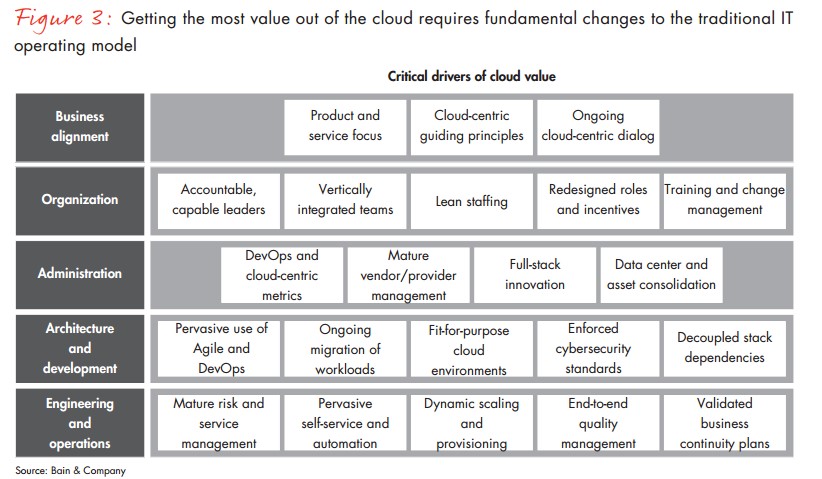
The researchers found several critical drivers of cloud value with one of the most important being the strengthening and clarifying of a product and service focus. The following graphic illustrates the critical drivers of cloud value.

getting the most value

Cloud Service Providers Give Manufacturers The Ability To Stay Competitive

Cloud-first strategies designed to accelerate and strengthen shifts in emerging business models is paying off according to Bain’s research results.

Manufacturers choosing to pursue a cloud-first strategy are focusing on evolving their business models, processes, systems and performance quickly to stay in step with customers’ needs. For many manufacturers, their customers’ pace is faster than internal IT organizations can anticipate and react to.  Cloud Service Providers are helping to close that gap.

Here are five ways CSPs are making manufacturers more competitive:

  • Bringing industry expertise to the shop floor level. The best CSPs serving manufacturers today have management teams that have decades of combined manufacturing experience in specific industries. The CEO of a specialty tools manufacturer remarked that his company’s cloud strategy was more focused on accelerating plant floor performance first.  Working with a CSP that had expertise in their industry, this manufacturer was able to gain greater supply chain visibility and improve forecast accuracy, all with cloud-based apps.
  • Solving legacy and third party system integration problems so that cloud-based ERP, CRM, supply chain management (SCM) systems can scale quickly. When a rust-belt based manufacturer of heating, ventilation and air conditioning (HVAC) systems had the opportunity to grow their business by expanding into build-to-order customized products, their CSP partner made it possible to integrate an entirely new product configurator and cloud-based ERP system module to manage quote-to-cash. Today, 30% of corporate-wide profits are from build-to-order selling strategies.
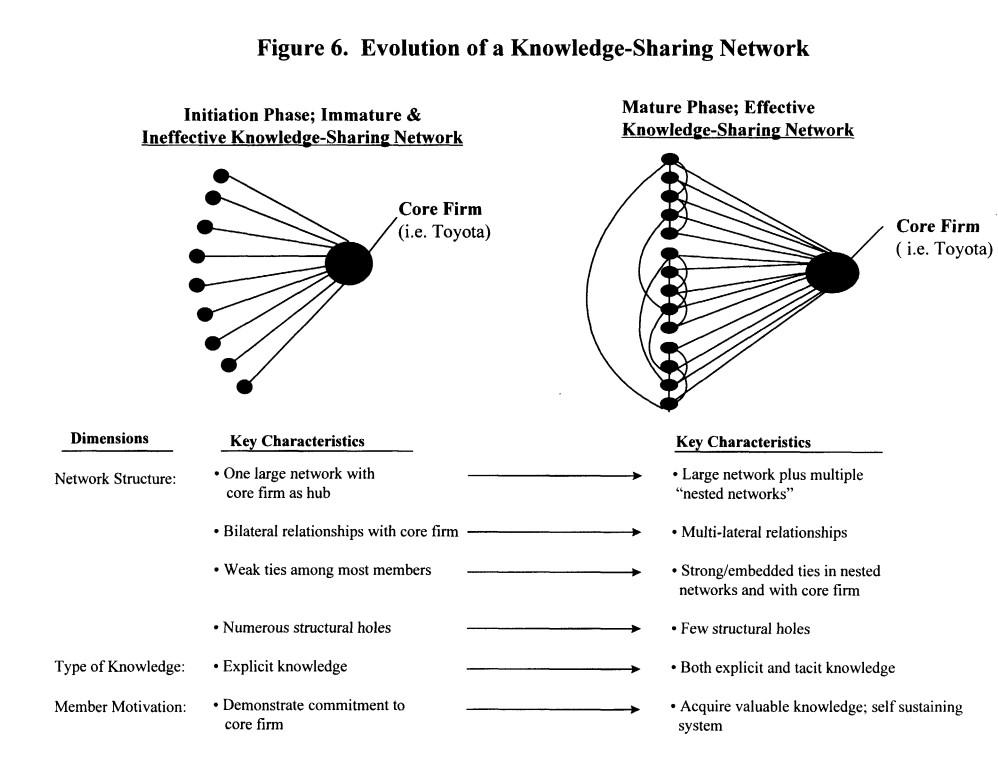
  • Knowledge-sharing supplier networks are becoming more attainable for manufacturers thanks to cloud technologies and CSPs. All manufacturers have strategic plans that include greater integration of their supplier networks, with many seeking to create knowledge-sharing networks. One of the best studies of how to create a knowledge-sharing network is from Dr. Jeffrey Dyer and Dr. Kentaro Nobeoka based on their intensive work with Toyota. Their study, Creating And Managing A High Performance Knowledge-Sharing Network: The Toyota Case is a great read. The following graphic from the study illustrates the evolution of a knowledge-sharing network. Manufacturers are relying on cloud platforms and CSPs to enable shifts in network structures and nurture change management to create self-sustaining systems.

Evolution of network

  • Two-tier ERP adoption in manufacturing is growing as CSPs master cloud ERP systems. CSPs are moving beyond providing basic services, specializing in cloud ERP, CRM, SCM, pricing, services and legacy system integration to keep pace with manufacturers’ demands. In one high tech manufacturer, their CSP partner orchestrated the procuring and launch of their cloud-based two-tier ERP system integrated to an SAP instance in their headquarters. Today they operate production centers in Asia, North America and Australia, all coordinated through the main SAP instance in the U.S. headquarters.
  • Making service level agreements (SLAs) more relevant to manufacturing business models. Instead of just getting SLAs for uptime, security and system stability, manufacturers are getting advanced manufacturing intelligence dashboards that provide visibility to the plant or production center level.

Bottom Line:  Manufacturers are increasingly relying on CSPs’ cloud, industry and integration expertise to support the transition many are making to new business models and get greater than 35% of the value from their cloud investments.

The top 100 cloud-based enterprise software startups of 2015

(c)iStock.com/maxkabakov

Investments in emerging enterprise software companies increased 53% from Q3 to Q4, 2014  according to MoneyTree Report, a collaborative research initiative between PricewaterhouseCoopers and the National Venture Capital Association.  A graphic from the latest available data shows how software investments were 39% of all investments in Q4, 2014.

To determine which enterprise software startups have gained the greatest amount of funding since they were founded, Mattermark was used to rank order all enterprise start-ups.  Mattermark uses a combination of artificial intelligence and data quality analysis to provide insights into over 1M companies, over 470K with employee data, and over 100,000 funding events.

invest by industry

Mattermark uses their Growth Score is the default ranking for all companies tracked in their service.  This score is not meant to provide guidance on which startup to invest in.  Rather it’s a measure of momentum across the metrics and KPIs that Mattermark measures.

Using their free trial, I completed the following analysis of cloud-based enterprise software startups. I’m not a consultant to Mattermark and never have been. As many readers find software investment data fascinating, I contacted Mattermark and asked for a free trial, which they graciously provided. You can download the list in Microsoft Excel format here. 

matrix