All posts by David_H_Deans

Digital dexterity: Exploring the new ways of work

As more progressive business leaders choose to support mobile, team-oriented and non-routine ways of working, an increasing number of them are looking for assistance in adopting digital workplace technology. But why are they searching for actionable information and qualified guidance?

According to the findings from the latest Gartner survey, only 7 to 18 percent of organizations possess the 'digital dexterity' to adopt New Ways of Work (NWOW) solutions — such as virtual collaboration and a mobile workplace. Furthermore, it's already apparent that forcing employees to accept rigid and inflexible workplace mandates are a recipe for poor performance.

Ongoing change reshapes the workforce

According to the Gartner assessment, an organization with high digital dexterity has employees who have the cognitive ability and social practice to leverage and manipulate media, information and technology in unique and highly innovative ways.

By country, organizations exhibiting the highest digital dexterity were those in the U.S. (18.2 percent of respondents), followed by those in Germany (17.6 percent) and then the UK (17.1 percent).

"Solutions targeting new ways of work are tapping into a high-growth area, but finding the right organizations ready to exploit these technologies is challenging," said Craig Roth, research vice president at Gartner.

In parallel, the survey found that workers in the United States, Germany and UK have, on average, higher digital dexterity than those in France, Singapore and Japan.

Workers in the top three countries were much more open to working from anywhere, in a non-office manner. They had a desire to use consumer software and websites at work. Some of the difference in workers' digital dexterity is driven by cultural factors, as shown by large differences between countries.

For example, population density impacts the ability to work outside the office, and countries with more adherence to organizational hierarchy had decreased affinity for social media tools that drive social engagement.

The youngest workers are the most inclined to adopt digital workplace products and services. They have a positive view of tech in the workplace and a strong affinity for working in non-office environments. Nevertheless, they reported the lowest levels of agreement with the statement that 'work is best accomplished in teams'.

The survey also showed that the oldest workers are the second most likely adopters of NWOW. Those aged 55 to 74 have the highest opinion of teamwork, have progressed to a position where there is little routine work, and have the most favorable view of all age groups of internal social networking technology.

Embracing vs. resisting workplace change

In contrast, workers aged 35 to 44 were at the low-point of the adoption dip, potentially feeling fatigued with the routines of life as middle age approaches. They were most likely to report that their jobs are routine, have the dimmest view of how technology can help their work, and are the least interested in mobile work. Moreover, larger organizations on average had higher digital dexterity than smaller ones.

"Embracing dynamic work styles, devices, work locations and team structures can transform a business and its relationship to its staff. But digital dexterity doesn't come cheap," said Mr. Roth. "It takes investment in workplace design, mobile devices and software, and larger organizations find it easier to make this investment."

Leaders that insist on a 'one-size-fits-all' approach to NWOW are doomed to fail.

Why optimal hybrid cloud champions will lead the market

Vendor revenue from sales of infrastructure products — server, storage, and Ethernet switch — for cloud IT grew by 45.5 percent year-over-year in the first quarter of 2018 (1Q18), reaching $12.9 billion according to the latest worldwide market study by International Data Corporation (IDC).

IDC also raised its forecast for total spending on cloud IT infrastructure in 2018 to $57.2 billion with year-over-year growth of 21.3 percent. Let's consider the key trends that are driving this phenomena. What really matters most, going forward?

Cloud infrastructure market development

Public cloud infrastructure quarterly revenue has more than doubled in the past three years to $9 billion in 1Q18, growing 55.8 percent year-over -year. Private cloud revenue reached $3.9 billion for an annual increase of 26.5 percent.

The combined public and private cloud revenues now represent 46.1 percent of the total worldwide IT infrastructure spending, up from 41.8 percent a year ago. Traditional (non-cloud) IT infrastructure revenue grew 22 percent from a year ago, although it's declined over the past several years — at $15.1 billion in 1Q18 it still represents 53.9 percent of total worldwide IT infrastructure spending.

"Hyperscaler datacenter expansion and refresh continued to drive overall cloud IT infrastructure growth in the first quarter," said Kuba Stolarski, research director at IDC. "While all infrastructure segments continued their strong growth, public cloud has been growing the most."

IDC expects this trend to continue through the end of 2018. Digital transformation initiatives such as edge computing and machine learning have been bringing new enterprise workloads into the cloud, driving up the demand for higher density configurations of cores, memory, and storage.

As systems technology continues to evolve towards pooled resources and composable infrastructure, the emergence of these next-generation workloads will drive net new growth beyond traditional enterprise workloads.

All regions grew their cloud IT Infrastructure revenue by double digits in 1Q18. Asia-Pacific (excluding Japan) grew revenue the fastest, by 74.7 percent year-over-year.

Next were the U.S. market (43.6 percent), Middle East & Africa (42.3 percent), Central and Eastern Europe (39.2 percent), Latin America (37.7 percent), Canada (29.4 percent), Western Europe (26.1 percent), and Japan (15 percent).

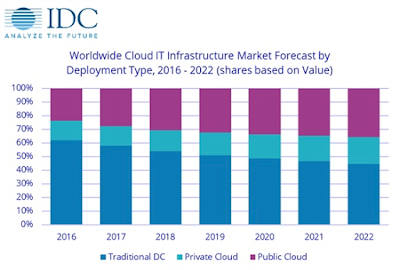
IDC's cloud IT infrastructure forecast measures total spend (vendor recognized revenue plus channel revenue). Of the $57.2 billion in cloud IT infrastructure spend forecast for 2018, public cloud will account for 67 percent of the total, growing at an annual rate of 23.6 percent. Private cloud will grow at 16.7 percent year-over-year.

That said, worldwide spending on traditional 'non-cloud' IT infrastructure is expected to grow by just 4.2 percent in 2018 as enterprises continue to refresh their legacy platforms. Traditional IT infrastructure will account for 54 percent of total end user spending on IT infrastructure products — that's down from 57.8 percent in 2017.

Outlook for cloud computing growth

This represents a decelerating share loss as compared to the previous four years. Moreover, the growing share of cloud environments in overall spending on IT infrastructure is common across all regions.

Long-term, IDC expects spending on cloud IT infrastructure to grow at a five-year compound annual growth rate (CAGR) of 10.5 percent — reaching $77.7 billion in 2022, and accounting for 55.4 percent of total IT infrastructure spend.

Public cloud datacenters will account for 64.7 percent of this amount, growing at a 10.2 percent CAGR. Spending on private cloud infrastructure will grow at a CAGR of 11.1 percent.

Some analysts already believe that it doesn't matter who leads the cloud infrastructure market, since it's essentially a commodity business with rapidly shrinking profit margins. So, what does really matter? Which vendors are best positioned to champion and lead the 'Optimal Hybrid Cloud' environment?

Digital skills are evolving – without IT organisation engagement

While there's less commentary about the challenges of "Shadow IT" projects within the enterprise market, the underlying issues that created this phenomena are still very apparent in the workplace. Bypassing the legacy IT organization is a common practice. It's now somewhat expected.

As many IT workers develop greater technology skills and apply them to advance their careers, savvy digital workers in non-IT departments believe their CIO is out of touch with their technology needs. Less than 50 percent of workers (both IT and non-IT) believe their CIOs are aware of digital technology problems that affect them, according to the latest worldwide market study by Gartner.

The Gartner survey further revealed that European workers said that their CIO is more aware of technical challenges (58 percent) than U.S. workers believe they are (41 percent). Clearly, it's a big problem.

Ongoing indifference to legacy IT

"Non-IT workers aren't likely to use the IT help desk as their first source of assistance, and are less likely to believe in the value of their IT organization," said Whit Andrews, vice president at Gartner. "Only one in five non-IT workers would ask their IT department to supply best practices for employing technology."

The survey findings revealed that savvy millennials were less likely to approach internal IT support. About 53 percent of surveyed millennials outside the IT department said that one of their first three ways to solve a problem with digital technology would be to look for an answer on the internet.

Non-IT workers were overall more likely than IT workers to express dissatisfaction with the technologies supplied for their work. IT workers express greater satisfaction with their work devices than do workers outside IT departments.

Only 41 percent of non-IT workers felt very or completely satisfied with their work devices, compared to 59 percent of surveyed IT workers. According to the Gartner assessment, many IT departments will be more successful if they are able to provide solutions that workers say they really need or want.

IT workers feel more confident than non-IT workers at using digital technology. The survey found that 32 percent of IT workers characterized themselves as experts in the digital technologies they use in the workplace. Just 7 percent of non-IT workers felt the same.

Sixty-seven percent of non-IT workers believe that their organization does not take advantage of their digital skills. Moreover, about three in four digital workers either somewhat agree (48 percent) or strongly agree (24 percent) that the digital technology their organization provides enables them to accomplish their work.

The most common types of workplace application used by survey respondents were real-time messaging (58 percent), sharing tools (55 percent), and workplace social media (52 percent).

Generational differences are commonplace

However, huge distinctions exist in the workplace. Millennial digital workers are more inclined than older age groups are to use workplace applications and devices that are not provided by their organization — whether they're tolerated or not by the CIO.

In addition, relative to the total workforce, a larger proportion of millennials consider the applications they use in their personal lives to be more useful than those they are given at work. The survey found that 26 percent of workers between the ages of 18 and 24 use un-approved applications to collaborate with other workers, compared with just 10 percent of those aged between 55 and 74.

Given this backdrop, it's very disconcerting for a CEO that has approved the IT budget for a significant digital transformation investment. If the IT infrastructure is deemed to be inadequate to meet the needs of the workers it's intended to benefit, then this is a major setback for the incumbent CIO. It's one of the key reasons why CIOs are still at risk of being disregarded by Line of Business (LoB) leaders.

Why digital transformation spending will reach $1.1 trillion – and what happens from here

Across the globe, CEOs continue to promote business technology-enabled growth. Worldwide spending on the technologies and services that enable digital transformation (DX) is forecast to be more than $1.1 trillion in 2018 – that's an increase of 16.8 percent over the $958 billion spent in 2017, according to the latest market study by International Data Corporation (IDC).

DX spending will be led by the discrete and process manufacturing industries, which will not only spend the most on DX solutions but also set the agenda for many DX priorities, programs, and use cases.

Discrete manufacturing and process manufacturing are expected to spend more than $333 billion combined on DX solutions in 2018. This represents nearly 30 percent of all DX spending worldwide this year.

From a technology perspective, the largest categories of spending will be applications, connectivity services, and IT services as manufacturers build out their digital platforms to compete in the digital economy.

The main objective and top spending priority of DX in both industries is smart manufacturing, which includes programs that focus on material optimization, smart asset management, and autonomic operations.

IDC expects the two industries to invest more than $115 billion in smart manufacturing initiatives this year. Both industries will also invest heavily in innovation acceleration ($33 billion) and digital supply chain optimization ($28 billion).

Driven in part by investments from the manufacturing industries, smart manufacturing ($161 billion) and digital supply chain optimization ($101 billion) are the DX strategic priorities that will see the most spending in 2018.

Other strategic priorities that will receive significant funding this year include digital grid, omni-experience engagement, omnichannel commerce, and innovation acceleration.

The strategic priorities that are forecast to see the fastest spending growth over the 2016-2021 forecast period are omni-experience engagement (38.1 percent compound annual growth rate (CAGR)), financial and clinical risk management (31.8 percent CAGR), and smart construction (25.4 percent CAGR).

"Some of the strategic priority areas with lower levels of spending this year include building cognitive capabilities, data-driven services and benefits, operationalizing data and information, and digital trust and stewardship," said Craig Simpson, research manager at IDC.

To achieve its DX strategic priorities, every business will develop programs that represent a long-term plan of action toward these goals. The DX programs that will receive the most funding in 2018 are digital supply chain and logistics automation ($93 billion) and smart asset management ($91 billion), followed by predictive grid and manufacturing operations (each more than $40 billion).

The programs that IDC expects will see the most spending growth over the five-year forecast are construction operations (38.4 percent CAGR), connected automated vehicles (37.6 percent CAGR), and clinical outcomes management (30.7 percent CAGR).

Each strategic priority includes a number of programs which are then comprised of use cases. These use cases are discretely funded efforts that support a program objective, and the overall strategic goals of an organization.

Outlook for new DX use cases

Use cases can be thought of as specific projects that employ line-of-business and IT resources, including hardware, software, and IT services. The use cases that will receive the most funding this year include freight management ($56 billion), robotic manufacturing ($43 billion), asset instrumentation ($43 billion), and autonomic operations ($35 billion).

The use cases that will see the fastest spending growth over the forecast period include robotic construction (38.4 percent CAGR), autonomous vehicles – mining (37.6 percent CAGR), and robotic process automation-based claims processing (35.5 percent CAGR) within the insurance industry.

In the construction industry, DX spending is expected to grow at a compound annual rate of 31.4 percent while retail, the third largest industry overall, is forecast to grow its DX spending at a faster pace (20.2 percent CAGR) than overall DX spending (18.1 percent CAGR).

Why digital business talent is a top priority for CEOs

Who is leading digital transformation at the most forward-thinking organizations across the globe, and what are the most significant roadblocks to their progress? That depends, on who you ask. Let's consider the most common digital business challenges today, and how savvy leaders overcome them.

Digital growth tops the list of CEO business priorities in 2018 and 2019, according to the latest worldwide market study by Gartner. However, as growth becomes harder to achieve, CEOs are concentrating on changing and upgrading the structure of their companies — including digital business investments.

Exploring digital business transformation culture

"Although growth remains a CEO's biggest priority, there was a significant fall in simple mentions of it this year, from 58 percent in 2017 to just 40 percent in 2018. This doesn't mean CEOs are less focused on growth, instead it shows that they're shifting perspective on how to obtain it," said Mark Raskino, vice president at Gartner.

The Gartner survey of CEO and senior business executives in the fourth quarter of 2017 examined their business issues, as well as some areas of technology agenda impact. In total, 460 business leaders in organizations with more than $50 million in annual revenue were qualified and surveyed.

IT remains a high priority coming in at the third position, and CEOs mention digital transformation, in particular. Workforce has risen rapidly this year to become the fourth-biggest priority, up from seventh in 2017. The number of CEOs mentioning workforce in their top three priorities rose from 16 percent to 28 percent.

However, when asked about the most significant internal constraints to growth, employee knowledge and progressive talent issues were at the very top of the list. CEOs said a lack of 'skilled talent' and workforce capability, by far,  is the biggest inhibitor of digital business development progress.

Culture change is a key aspect of digital transformation. Gartner found that CIOs agreed it was a very high-priority, but only 37 percent of CEOs said a significant or deep culture change is needed by 2020. Regardless, when companies that have a digital growth initiative are compared with those that don't, the proportion in need of culture change rose to 42 percent. Enough said.

"These survey results show that if a company has a digital initiative, then the recognized need for culture change is higher," said Mr. Raskino. "The most important types of change that CEOs intend to make include making the culture more proactive, collaborative, innovative, empowered and customer-centric. They also highly rate a move to a more digital and tech-centric culture."

Survey respondents were asked whether they have a management initiative or transformation program to make their business more digital. Sixty-two percent said they did. Of those organizations, 54 percent said that their digital business objective is transformational while 46 percent said the objective of the initiative is optimization.

In the background, CEOs' that use of the word 'digital' has been steadily rising. When asked to describe their top five business priorities, the number of respondents mentioning the word 'digital' at least once has risen from 2.1 percent in the 2012 survey to 13.4 percent in 2018.

This attitude toward digital business development is backed up by CEOs' continuing intent to invest in IT infrastructure. Sixty-one percent of respondents intend to increase spending on IT in 2018, while 32 percent plan to make no changes to spending and only seven percent foresee spending cuts.

Ongoing digital culture development challenge

The Gartner survey showed that the percentage of survey respondents who think their company is an 'innovation pioneer' has reached a high of 41 percent — that's up from 27 percent in 2013 — with fast followers not far behind at 37 percent.

"CIOs should leverage this bullish sentiment by encouraging their business leaders into making commitments to digital business change," said Mr. Raskino. "However, superficial digital change can be a dangerous form of self-deceit. The CEO's commitment must be grounded in deep fundamentals, such as genuine customer value, a real business model concept and disciplined economics."

How digital business skill demand is driving IT investment

Strategic investment in business technology is led by CIOs and CTOs that launch new digital transformation initiatives. Those digital growth plans result in the modernization of IT infrastructure. However, an internal IT staff skills shortfall will continue to fuel demand for more savvy and experienced digital business talent.

Worldwide revenues for IT Services and Business Services totaled $502 billion in the second half of 2017 (2H17) — that's an increase of 3.6 percent year-over-year (in constant currency), according to the latest market study by International Data Corporation (IDC).

Digital business services market development

"As customers look to digital transformation initiatives to stay relevant in the new economy, vendors face both opportunities and challenges," said Xiao-Fei Zhang, program director at IDC. "While automation and new cloud delivery models reduce overall price, new digital services will require clients to spend more time and resources to modernize their existing IT environment,"

For the full year 2017, worldwide services revenues came to just shy of the $1 trillion mark. Year-over-year growth was around 4 percent, which slightly outpaced the worldwide GDP growth rate.

The growth in professional services reflects stronger business confidence that's fueled by a brighter economic outlook and a shared sense of urgency for large-scale digital transformation projects.

Looking at different services markets, project-oriented revenues continued to outpace outsourcing and support & training, mainly due to organizations freeing up pent-up discretionary spending from earlier years and feeling the need to digitize their organizations via large scale projects.

Specifically, project-oriented markets grew 4.6 percent year-over-year to $186 billion in 2H17 and 5 percent to $366 billion for the entire year. Most of the above-the-market growth came from business consulting: its revenue grew by almost 7.8 percent in 2H17 and 8.2 percent for the entire year to $115 billion.

In large digital transformation projects, high-touch business consultants continue to extract more value than mere IT resources do. Most major management consulting firms posted strong earnings in 2017.

IT-related project services, namely custom application development (CAD), IT consulting (ITC), and systems integration (SI), still make up the bulk — more than two thirds — of the overall project-oriented market.

While growing slower than business consulting, these three markets showed significant improvement over the previous year: CAD, ITC, and SI combined grew by 3.7 percent year-over-year to $251 billion for the full year 2017.

IDC believes that some 2015 and 2016 projects were pushed out to 2017, which helped to drive up spending during 2H17. This coincides with the strong rebound on the software side, as IT project-related services are largely application driven.

Because large digital business projects not only drive up new services but also pull in traditional services, IDC believes that the actual volume of IT project services grew even faster in 2017 but was offset somewhat by lower pricing.

In outsourcing, revenues grew by 3.3 percent year-over-year to $238 million in 2H17. Application-related managed services revenues (hosted and on-premise application management) outpaced the general market – growing more than 6 percent in 2H17 and 5.8 percent for the entire year.

Enterprise buyers have leveraged automation and cloud delivery to reduce the cost of operating IT applications. For example, infusing artificial intelligence (AI) into application life-cycle activities to drive better predictive maintenance and application portfolio management.

However, in their continuing drive for digital transformation, organizations are increasingly relying on external professional services providers to navigate complex technical environments and supply talent with new skills (hybrid cloud, big data analytics, machine learning, blockchain).

Digital transformation also requires organizations to standardize and modernize their existing IT application assets. Therefore, IDC forecasts application outsourcing markets to continue outpacing other outsourcing markets in the coming years.

Outlook for IT outsourcing service growth

On the infrastructure side, while hosting infrastructure services revenue grew by 4.9 percent in 2H17, positively impacted by cloud adoption, IT Outsourcing (ITO), a larger market, declined by 2 percent. Combined, the two markets were essentially flat.

IDC believes that while overall infrastructure demand remains robust, the ITO market is negatively impacted the most by cloud cannibalization across all regions: cloud, particularly public cloud, reduces price far greater than new demand grows. For example, IDC estimates that, by 2021, almost one third of ITO services revenue will be cloud-related.

Why public cloud revenue will reach $186.4 billion in 2018

Around the globe, CIOs and CTOs continue to transition to a hybrid multi-cloud service delivery model, supported by on- and off-premises IT infrastructure. Meanwhile, the worldwide public cloud services market is projected to grow 21.4 percent in 2018 to reach $186.4 billion – that's up from $153.5 billion in 2017.

The fastest-growing segment of the market is cloud Infrastructure as a Service (IaaS), which is forecast to grow 35.9 percent in 2018 to reach $40.8 billion, according to the latest worldwide market study by Gartner.

Public cloud market development

Moreover, Gartner expects the top 10 cloud service providers to account for nearly 70 percent of the IaaS market by 2021 – that's up from 50 percent in 2016.

"The increasing dominance of the hyperscale IaaS providers creates both enormous opportunities and challenges for end-users and other market participants," said Sid Nag, research director at Gartner.

According to the Gartner assessment, while public cloud enables efficiencies and cost benefits, organizations need to be cautious about IaaS providers potentially gaining unchecked influence over CIO and CTO budgets.

In response to multi-cloud adoption trends, organizations will increasingly demand a simpler way to move workloads, applications and data across cloud providers' IaaS offerings without penalties. And, cloud migration and management tools will be instrumental in easing the transition to hybrid IT scenarios.

Software as a service (SaaS) remains the largest segment of the cloud market, with revenue expected to grow 22.2 percent to reach $73.6 billion in 2018. Gartner expects SaaS to reach 45 percent of total application software spending by 2021.

"In many areas, SaaS has become the preferred delivery model," said Mr. Nag. "Now SaaS users are increasingly demanding more purpose-built offerings engineered to deliver specific business outcomes."

Within the platform as a service (PaaS) category, the fastest-growing segment is database platform as a service (dbPaaS), expected to reach almost $10 billion by 2021. Hyperscale cloud providers are increasing the range of services they offer to include dbPaaS.

"Although these large vendors have different strengths, and customers generally feel comfortable that they will be able to meet their current and future needs, other dbPaaS offerings may be good choices for organizations looking to avoid lock-in," said Nag.

Outlook for public cloud market growth

Although public cloud revenue is growing more than initially forecast, Gartner expects growth rates to stabilize from 2018 onward, reflecting the maturity that public cloud services will gain within a wider IT spending mix that includes private cloud and traditional on-premises IT infrastructure.

Note that this forecast excludes cloud advertising, which was removed from Gartner's public cloud service forecast segments in 2017.

Why the cloud IT infrastructure market is set to reach $52.3bn in 2018

Cloud service adoption continues to grow, as traditional IT vendors react to market demand. Total spending on IT infrastructure products for deployment in cloud environments is forecast to reach $52.3 billion in 2018 — that's year-over-year growth of 10.9 percent, according to the latest worldwide market study by International Data Corporation (IDC).

Public cloud data centers will account for a majority of this spending, 65.9 percent, growing at the fastest annual rate of 11.3 percent. Off-premises private cloud environments will represent 13 percent of cloud IT infrastructure spending, growing at 12 percent year over year.

On-premises private clouds will account for 61.7 percent of spending on private cloud IT infrastructure and will grow 9.1 percent year-over-year in 2018.

Cloud IT infrastructure market development

"Growing expansion of digital transformation initiatives enables further adoption of cloud-based solutions around the globe. This will result in a continuous shift in the profile of IT infrastructure buyers. SaaS, PaaS, and IaaS offerings address a broad range of business and IT needs of enterprises from 'lift-and-shift' to emerging workloads," said Natalya Yezhkova, research director at IDC.

Worldwide spending on traditional, non-cloud, IT infrastructure is expected to decline by 2 percent in 2018 but nevertheless will account for the majority, 54.7 percent, of total end-user spending on IT infrastructure products — that's down from 57.8 percent in 2017.

This latest decline represents a faster share loss than in the previous three years. Moreover, the growing share of cloud environments in overall spending on IT infrastructure is common across all regions of the world.

In cloud IT environments, spending in all technology segments, except for storage platforms, is forecast to grow at double digit rates in 2018. Ethernet switches and compute platforms will be the fastest growing at 20.9 percent and 12.4 percent, respectively, while spending on storage platforms will grow 6 percent. Investments in all three technologies will increase across all cloud deployment models – public cloud, private cloud off-premises, and private cloud on-premises.

Long-term, IDC expects spending on off-premises cloud IT infrastructure will grow at a five-year compound annual growth rate (CAGR) of 10.8 percent, reaching $55.7 billion in 2022.

Public cloud datacenters will account for 83.6 percent of this amount growing at a 10.6 percent CAGR while spending on off-premises private cloud infrastructure will increase at a CAGR of 11.4 percent.

Outlook for cloud IT infrastructure growth

Combined with on-premises private cloud, overall spending on cloud IT infrastructure will grow at an 10.9 percent CAGR and by 2022 will surpass spending on non-cloud IT infrastructure.

Spending on on-premises private cloud IT infrastructure will grow at a 11.5 percenet CAGR, while spending on non-cloud IT (on-premises and off-premises combined) will decline at a 2.7 percent CAGR during the same period.

Traditional IT vendors must act now to assure their survival in the evolving domain of hyperscale multi-cloud service offerings, and prepare for the predictable reduction in demand for legacy data center infrastructure. New momentum this year signifies the acceleration of a pivotal transformation in the shift to a hybrid multi-cloud era.

How enterprise IT investment is being driven by C-level strategy

In the evolving global networked economy, every type of company essentially becomes a technology-oriented firm – in one form or another. That's fueling the strategic investment in IT infrastructure and services. Currency market changes are another key factor.

As a result, worldwide IT spending is projected to total $3.7 trillion in 2018 — that's an increase of 6.2 percent from 2017, according to the latest market study by Gartner. Senior executives and line of business leaders continue to drive many of the strategic IT procurement decisions.

IT infrastructure market development

"Although global IT spending is forecast to grow 6.2 percent this year, the declining U.S. dollar has caused currency tailwinds, which are the main reason for this strong growth," said John-David Lovelock, vice president at Gartner.

This is the highest annual growth rate that Gartner has forecast since 2007 and would be a sign of a new cycle of IT growth. However, spending on IT around the world is growing at expected levels and is in line with expected global economic growth.

Through 2018 and 2019, the U.S. dollar is expected to trend stronger while enduring tremendous volatility due to the uncertain political environment, the North American Free Trade Agreement renegotiation and the potential for an innovation trade-war with China.

Enterprise software spending is forecast to experience the highest growth in 2018 with an 11.1 percent increase. The software industry is expected to capitalize on the evolution of digital business. Application software spending will continue to rise through 2019, and infrastructure software will also continue to grow — bolstered by IT modernization initiatives.

Even with a strong end to 2017, worldwide spending on traditional data centre systems is forecast to grow 3.7 percent in 2018 – but that's down from 6.3 percent growth in 2017. The longer-term outlook continues to have challenges, particularly for the data storage segment. Blame lies in the advance of public cloud computing adoption.

The strength at the end of 2017 was primarily driven by the component shortage for semiconductor memory, and prices have increased at a greater rate than previously expected. According to the Gartner assessment, the shortages will likely continue throughout the year with the supply not expected to ease until the end of the year.

Outlook for end-user device investment

Worldwide spending for devices – i.e. personal computers, media tablets and smartphones – is forecast to grow in 2018, reaching $706 billion, an increase of 6.6 percent from 2017. The device market continues to see dual dynamics. Some users are holding back from buying, and those that are buying are doing so, on average, at higher price points.

As a result, end-user spending will increase faster than units through 2022. However, total end-user spending and unit shipments are expected to be lower compared with previous forecasts, as demand for ultra-mobile premium devices, ultra-mobile utility devices and basic mobile phones is expected to be slow.

How converged systems revenue has reached $12.5 billion

Worldwide converged systems market revenue increased 9.1 percent year-over -year to $3.6 billion during the fourth quarter of 2017 (4Q17), according to the latest market study by International Data Corporation (IDC).

Full-year sales surpassed $12.5 billion in 2017, representing a 9.4 percenet increase over the previous year and the first time the market surpassed $12 billion in a calendar year.

Converged systems market development

"The number of organizations deploying converged systems continued to expand through 2017," said Eric Sheppard, research vice president at IDC.

Growing demand drove the total market value. While not all market segments increased during the year, those that did grow were able to provide considerable benefits related to the most core infrastructure challenges facing today's data centers.

IDC's converged systems market view offers three segments: certified reference systems & integrated infrastructure, integrated platforms, and hyperconverged systems. Certified reference systems & integrated infrastructure are pre-integrated, vendor-certified systems containing server hardware, disk storage systems, networking equipment, and basic element or systems management software.

Integrated platforms are integrated systems that are sold with additional pre-integrated packaged software and customized system engineering optimized to enable such functions as application development software, databases, testing, and integration tools. Hyperconverged systems collapse core storage and compute functionality into a single, highly virtualized solution.

A key characteristic of hyperconverged systems that differentiate these solutions from other integrated systems is their scale-out architecture and their ability to provide all compute and storage functions through the same x86 server-based resources. Market values for all three segments includes hardware and software but excludes services and support.

The certified reference systems & integrated infrastructure market generated $1.7 billion in revenue during the fourth quarter, which represents a 3.4 percent year-over-year decline and 47.1 percent of the total converged systems market value.

Revenue from hyperconverged systems sales grew 69.4 percent year over year to $1.25 billion during the fourth quarter of 2017. This amounted to 34.3 percent of the total converged systems market. Full-year sales of hyperconverged systems surpassed $3.7 billion in 2017 — that's up by 64.3 percent from 2016.

Integrated platforms sales declined 18.1 percent year over year during the fourth quarter of 2017, generating revenues of $675.5 million. This amounted to 18.6 percent of the total converged systems market value.